

Self-Represented Parties – The Numbers
New Filings in 2014
In 2014, even with a substantial decline in its overall number of filings, the Central District of California continued to lead the nation with over 57,000 filings. More than 23 percent of these filings were filed without an attorney (self-represented or pro se), approximately 16.1 percent of the nation’s total pro se bankruptcy filings. The total percentage of pro se filings nationwide was approximately 8.8 percent. The District has more than twice the number of pro se filings as the bankruptcy court with the next highest number of total pro se filings, the Middle District of Florida.
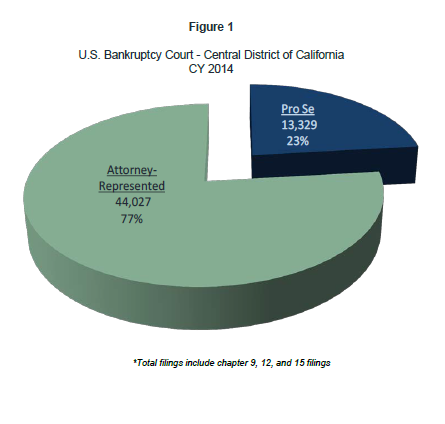
Figure 1 shows the breakdown between represented and pro se debtors in all chapters filed in 2014. This does not include the numerous pro se creditors whom our case filing system cannot track. In 2014, the Court’s pro se rate remained relatively about the same as the previous year: 23.2 percent, compared to 24.7 percent in 2013.
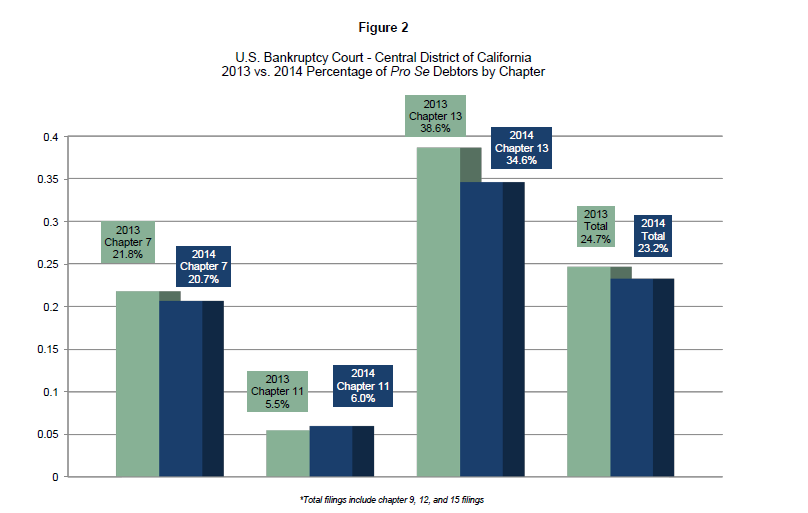
Almost 80 percent of all bankruptcy cases filed in the Central District were chapter 7 cases. Figure 2 shows that over one-fifth of the Court’s chapter 7 cases were filed by self-represented parties in 2014 – a sizeable portion of the Court’s largest segment of filings.
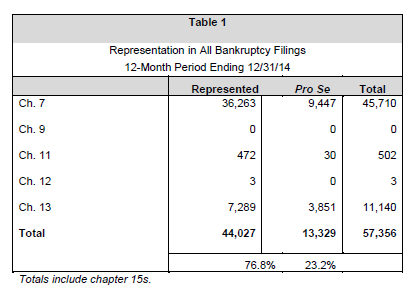
The second most filed bankruptcy chapter in the District was chapter 13. As shown by Figure 2, chapter 13 has a higher rate of pro se debtors than in chapter 7. This may be due to the pro se debtors seeking a cost savings in obtaining the automatic stay, as the actual filing fee of $310 is slightly less than the chapter 7 fee of $335. This could also be the result of foreclosure mitigation schemes using chapter 13 as a means to obtain a stay without the oversight of a chapter 7 trustee. The breakdown of how many debtors filed each chapter, and whether represented or not, is detailed in Table 1.
Cases Reaching Final Disposition in 2014
The graphs in this section illustrate the incidence of significant bankruptcy case events (e.g. confirmation, discharge, dismissal and closing) within the calendar year of 2014. The calendar year approach used in previous reports failed to present a complete picture for a small number of cases. For example, if a case is filed in December 2014, it will not have progressed to the point of having a plan confirmed or receiving a discharge or dismissal within the calendar year.
The revised method in this report accounts for the fact that many bankruptcy cases continue into subsequent years before the case reaches a final disposition. Even with the limitations of the data presented based on cases filed within a calendar year, used in past reports, we found no significant variation from the conclusions reached when analyzing the same data based on the cases closed.
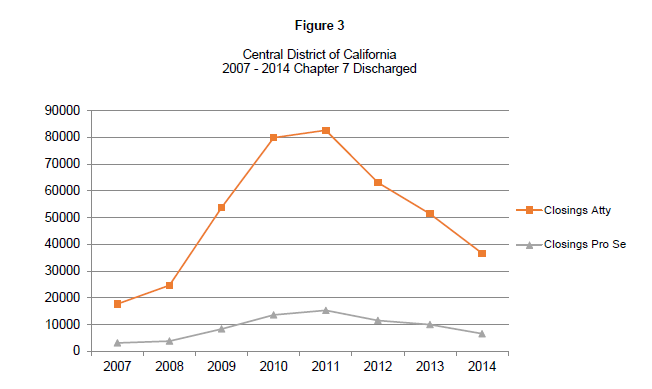
As shown in Figure 3, every year a far larger number of chapter 7 debtors hire attorneys for representation. The number of self-represented cases closed with a discharge was significantly lower than for the attorney-represented cases, especially in the years from 2009 to 2011. The steep curve of the attorney-represented line reflects a peak in the number of filings following the Great Recession of 2008. A slight lag time in the number of discharges following the 2008 filings may have been due to the Clerk’s Office catching up on a backlog of cases to discharge from these peak filings. The number of self-represented chapter 7 debtors who received a discharge did not increase in proportion to the number of self-represented cases filed over peak filing years. This, once again, underscores the relatively poor success rate of self-represented debtors in chapter 7.
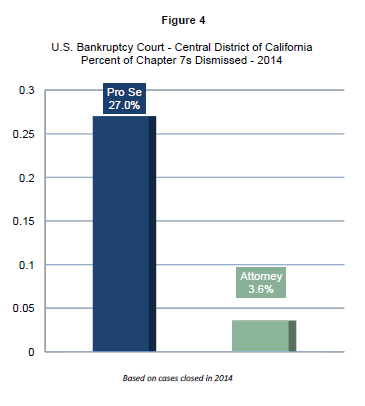
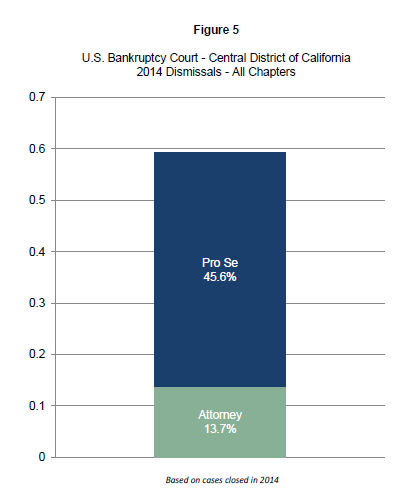
Pro se cases represented nearly a third of the chapter 7 cases that were dismissed. The percentage of attorney-represented chapter 7 cases that were dismissed, on the other hand, was miniscule (Figure 4). For all chapters, pro se cases were dismissed at an even higher rate, approaching almost half of the dismissed cases for the year (Figure 5). At 13.7 percent, dismissals of attorney-represented cases were only a slightly higher rate, when considering all chapters, than for chapter 7, alone (Figure 5).
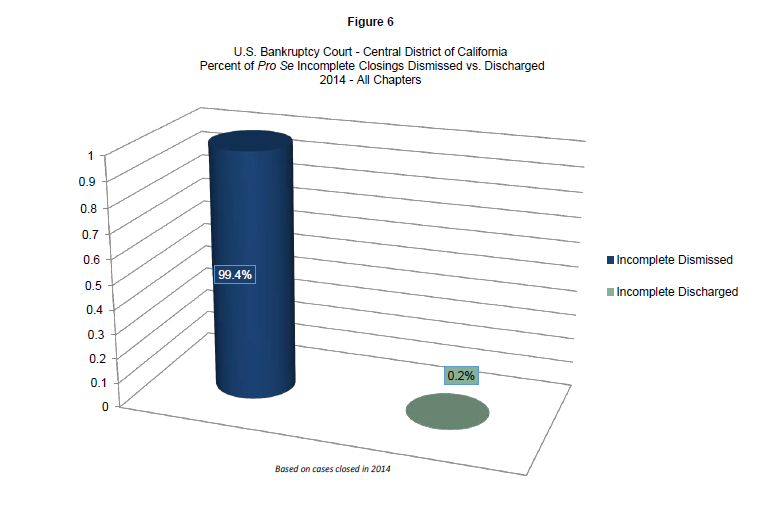
Incomplete cases are those cases filed without all required schedules and the statement of financial affairs. When everything required under Federal Rule of Bankruptcy Procedure 1007 is not filed, the case is typically dismissed after 14 days (See 11 U.S.C. § 521). This may be due to filers hastily seeking the protection of the automatic stay to forestall events such as imminent foreclosures or evictions. In their haste, these debtors may neglect to file the correct papers or meet the necessary deadlines for filing schedules. The debtor may obtain the protection of the automatic stay for a couple of weeks, but fail to receive a discharge of debts and raise a presumption of abuse in future filings (See 11 USC § 362(b)(21)).
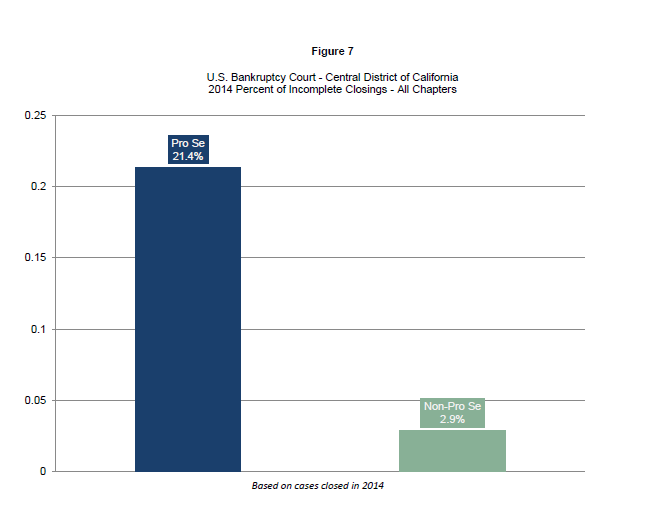
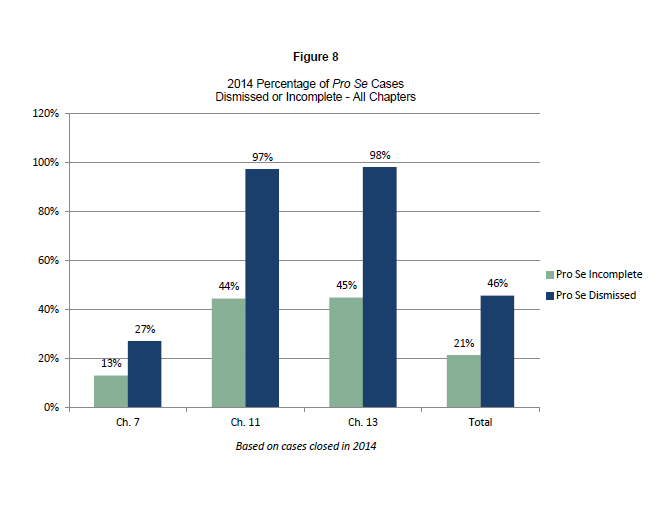
Dismissal is almost a certainty for self-represented parties who do not file a complete petition package. Figure 6 shows that the percentage of pro se cases filed with incomplete information that were dismissed was over 99 percent. More incomplete cases are filed by pro se debtors (over 21 percent) as compared to about three percent of attorney-represented cases (Figure 7). Figure 8 illustrates the rate of incomplete cases in 2014, compared to the total rate of dismissed pro se cases in each bankruptcy chapter for that year.
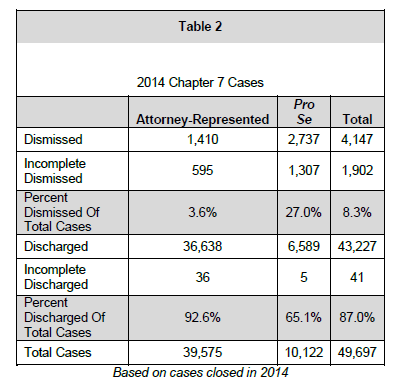
In 2014, nearly twice the number of pro se chapter 7 cases were dismissed as attorney-represented cases. A similar trend emerges regarding the number of incomplete chapter 7 pro se cases that were dismissed as compared to attorney-represented incomplete cases (Table 2).
Given that attorneys filed almost four times the number of chapter 7 cases as self-represented parties (Table 1), the higher number of pro se cases that were dismissed is especially striking (Table 2).